


-
NHRA Power Rankings: Matt Hagan still quick, fast despite slow start to 2020
-
NHRA Power Rankings: Nobody quicker in Top Fuel than Brittany Force, David Grubnic
-
NHRA Power Rankings: Champions top charts in Pomona
-
NHRA Power Rankings: Matt Hagan hung around for one last shot in Pomona

-
NHRA Power Rankings: Good things on the horizon for Jordan Vandergriff
-
-
NHRA Power Rankings: David Grubnic, Brittany Force on right path in first season together
-
NHRA Power Rankings: It pays to have great drivers
-
NHRA Power Rankings: Jason Line leads Pro Stock in more ways than one
-
NHRA Power Rankings: Doug Kalitta can beat Steve Torrence with a little luck
-
NHRA Power Rankings: Ron Capps is starting to make it feel a lot like 2016
-
NHRA Power Rankings: Jeg Coughlin Jr. and Erica Enders just need luck to go their way
-
NHRA Power Rankings: Billy Torrence keeps things interesting with his NHRA Sonoma Nationals win

-
NHRA Power Rankings: What the last six races can tell us about Greg Anderson, Tommy Johnson Jr. and the Countdown to the Championship
-
NHRA Power Rankings: Scott Palmer makes renewed NHRA Countdown bid
-
NHRA Power Rankings: Is Deric Kramer poised for a championship chase?

-
NHRA Power Rankings: Aggression pays off for Bob Tasca III and Mike Salinas
-
NHRA Power Rankings: Is Billy Torrence going to make the Countdown to the Championship?
-
NHRA Power Rankings: Erica Enders, Andrew Hines take over top spots following Route 66 NHRA Nationals
-
NHRA Power Rankings: Bo Butner wins again, highlights great K.B. Racing weekend
-
NHRA Power Rankings: Doug Kalitta, Tim Wilkerson, Andrew Hines have reason for optimism after Arby's NHRA Southern Nationals
-
NHRA Power Rankings: Tim Wilkerson, Mike Salinas, Jerry Savoie biggest movers
-
NHRA Power Rankings Explained: Getting to know the newest drag racing stat
-
Power Rankings: Robert Hight flexes again following SpringNationals victory
-
NHRA Power Rankings: Leaders hold position after Las Vegas Four Wide
-
Power Rankings: Jeg Coughlin, Eddie Krawiec new leaders in Pro Stock, Pro Stock Motorcycle
-
Robert Hight, Steve Torrence, Erica Enders lead NHRA Power Rankings following NHRA Arizona Nationals
-
Steve Torrence, Tommy Johnson Jr., Erica Enders top first Power Rankings update of 2019

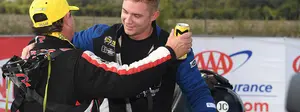
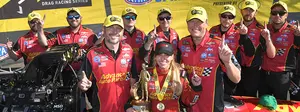
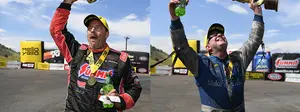
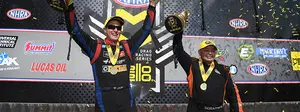
NHRA Power Rankings: Bo Butner wins again, highlights great K.B. Racing weekend
Pro Stock returned to the NHRA Mello Yello Drag Racing circuit and no team looked better than K.B. Racing. Jason Line put his Summit Chevrolet on the pole, Bo Butner won the race and Greg Anderson took runner up. That dominance may not last, but that sort of triumphant return looked as good on paper as it did on the track – and it doesn’t always happen that way.
That’s, in part, why NHRA Power Rankings exist. Your quarter mileage may vary on their success, but the reasoning holds up. The team that brings home the Wally doesn’t always have the best day – that’s kind of the fun of it. But if we want to know who’s having a great season without looking at the points [which you’re welcome to do, here], we needed a way to take some of the luck out of the equation.
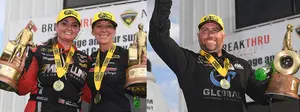
Luck wasn’t much of a factor in K.B. Racing’s dominance at the Virginia NHRA Nationals. Seven of the best 10 Pro Stock runs came with K.B. Racing horsepower and 15 of the 24 6.50s were supplied by the same power plant. That’s a good recipe for success, although in Pro Stock reaction times play a part, too. Butner was pretty much himself in that area, averaging a .046 reaction time compared to a class average (on the day) of .044. The overall class average is .049 and Butner averages a .047.
As such, you’ll see Butner picked up 2.52 points – primarily on the back of good horsepower after Pro Stock took 41 days off. He now holds four wins in five races and sits just seven points behind Jeg Coughlin Jr. for the NHRA Power Ranking lead. Why? The car performance is similar, but Butner gives up a hundredth at the starting line and his Camaro is slightly less consistent. Something tells me he won’t be trading his four Wallys for an NHRA Power Rankings trophy.
OTHER NOTES
- Clay Millican moved back into the top 10 after qualifying No. 1 with Mike Kloeber. The car struggles with consistency, but this is the highest its been ranked (NHRA Power Ranking-wise) since Pomona.
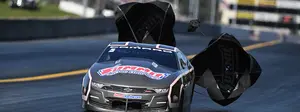
- Doug Kalitta hasn’t had any manner of luck on Sunday, but that Mac Tools car is really good, and some people are going to be surprised if it starts turning on win lights. Surprises can be fun!
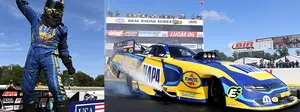
- J.R. Todd and the DHL Toyota Camry team put together an amazing weekend, running 4.0s and better until the final when they blew the tires off. He, along with back-to-back winner Ron Capps, moved up two spots.
- While this was very K.B. Racing-heavy – Elite Performance had a very fine weekend, too. I like that team’s chances of ending up with the big trophy at the end of the year, and not just because Jeg and Erica Enders sit at the top of the NHRA Power Rankings leaderboard [it’s because they’re the best drivers].
- Andrew Hines added another 9.02 points to his ledger and is now just 1.35 points behind teammate Eddie Krawiec for the NHRA Power Rankings lead. He’ll pass him by the time we leave Chicago unless something disastrous happens.
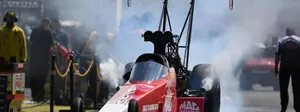
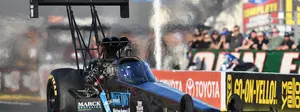
TOP FUEL
| Ranking | Driver | Elapsed Time | Success Rate | Reaction Time | Average Speed | Power Ranking | Point Change | Position Change |
|---|---|---|---|---|---|---|---|---|
| 1 | Steve Torrence | 3.772 | 84% | 0.073 | 324.24 | 74.51 | 0.62 | 0 |
| 2 | Doug Kalitta | 3.759 | 74% | 0.060 | 321.95 | 71.92 | 2.11 | 3 |
| 3 | Mike Salinas | 3.771 | 75% | 0.088 | 325.78 | 68.34 | 1.00 | 1 |
| 4 | Jordan Vandergriff | 3.775 | 70% | 0.068 | 322.44 | 64.29 | 6.65 | 2 |
| 5 | Billy Torrence | 3.792 | 76% | 0.074 | 323.92 | 60.94 | -8.46 | -2 |
| 6 | Terry McMillen | 3.774 | 61% | 0.070 | 323.60 | 56.49 | 2.79 | 1 |
| 7 | Leah Pritchett | 3.781 | 61% | 0.077 | 323.88 | 53.70 | 0.33 | 1 |
| 8 | Antron Brown | 3.789 | 63% | 0.063 | 322.59 | 53.30 | -6.03 | -3 |
| 9 | Brittany Force | 3.780 | 67% | 0.081 | 317.90 | 47.65 | 0.33 | 0 |
| 10 | Clay Millican | 3.791 | 60% | 0.067 | 319.14 | 44.91 | 4.31 | 1 |
FUNNY CAR
| Ranking | Driver | Elapsed Time | Success Rate | Reaction Time | Average Speed | Power Ranking | Point Change | Position Change |
|---|---|---|---|---|---|---|---|---|
| 1 | Robert Hight | 3.957 | 75% | 0.073 | 323.97 | 83.63 | 4.29 | 0 |
| 2 | Matt Hagan | 3.972 | 83% | 0.078 | 320.64 | 75.34 | 3.60 | 0 |
| 3 | John Force | 4.007 | 82% | 0.077 | 322.63 | 66.52 | 3.68 | 0 |
| 4 | Jack Beckman | 3.982 | 56% | 0.077 | 322.73 | 59.53 | 4.80 | 0 |
| 5 | J.R. Todd | 4.001 | 64% | 0.067 | 318.72 | 54.40 | 6.19 | 2 |
| 6 | Shawn Langdon | 4.020 | 68% | 0.064 | 319.25 | 51.47 | 0.45 | -1 |
| 7 | Tim Wilkerson | 3.981 | 55% | 0.085 | 319.59 | 51.13 | 2.12 | -1 |
| 8 | Ron Capps | 4.016 | 71% | 0.071 | 316.30 | 50.36 | 5.26 | 2 |
| 9 | Tommy Johnson Jr | 4.014 | 64% | 0.079 | 317.65 | 48.44 | 11.44 | 2 |
| 10 | Bob Tasca III | 4.029 | 71% | 0.066 | 317.30 | 45.94 | -0.54 | -1 |
PRO STOCK
| Ranking | Driver | Elapsed Time | Success Rate | Reaction Time | Average Speed | Power Ranking | Point Change | Position Change |
|---|---|---|---|---|---|---|---|---|
| 1 | Jeg Coughlin | 6.561 | 85% | 0.036 | 209.30 | 78.81 | 0.98 | 0 |
| 2 | Erica Enders | 6.564 | 80% | 0.032 | 209.18 | 75.52 | 2.91 | 1 |
| 3 | Bo Butner | 6.561 | 78% | 0.046 | 209.76 | 71.35 | 2.52 | 1 |
| 4 | Alex Laughlin | 6.562 | 78% | 0.053 | 209.11 | 67.99 | 0.15 | 1 |
| 5 | Jason Line | 6.556 | 73% | 0.052 | 209.80 | 67.07 | 2.20 | 1 |
| 6 | Rodger Brogdon | 6.556 | 78% | 0.071 | 210.11 | 65.92 | -7.75 | -4 |
| 7 | Deric Kramer | 6.564 | 61% | 0.027 | 208.81 | 63.65 | 6.00 | 1 |
| 8 | Greg Anderson | 6.561 | 68% | 0.057 | 209.69 | 59.03 | 3.24 | 1 |
| 9 | Matt Hartford | 6.565 | 68% | 0.047 | 208.38 | 57.12 | -1.34 | -2 |
| 10 | Kenny Delco | 6.573 | 75% | 0.071 | 208.59 | 55.22 | 1.05 | 0 |
PRO STOCK MOTORCYCLE
| Ranking | Driver | Elapsed Time | Success Rate | Reaction Time | Average Speed | Power Ranking | Point Change | Position Change |
|---|---|---|---|---|---|---|---|---|
| 1 | Eddie Krawiec | 6.855 | 100% | 0.039 | 196.59 | 87.75 | 1.97 | 0 |
| 2 | Andrew Hines | 6.846 | 90% | 0.040 | 195.74 | 86.40 | 9.02 | 2 |
| 3 | Matt Smith | 6.839 | 85% | 0.050 | 197.24 | 82.90 | 7.70 | -1 |
| 4 | Hector Arana Jr | 6.880 | 93% | 0.057 | 196.03 | 72.58 | -2.20 | -1 |
| 5 | Jerry Savoie | 6.891 | 79% | 0.049 | 193.27 | 59.47 | 0.59 | 2 |
| 6 | Angelle Sampey | 6.879 | 71% | 0.063 | 193.72 | 55.11 | 6.67 | 1 |
| 7 | Ryan Oehler | 6.911 | 81% | 0.047 | 195.05 | 50.38 | 5.17 | 2 |
| 8 | Joey Gladstone | 6.888 | 57% | 0.028 | 193.36 | 49.06 | -6.35 | -2 |
| 9 | Karen Stoffer | 6.910 | 63% | 0.026 | 192.92 | 44.62 | 1.43 | 1 |
| 10 | Jimmy Underdahl | 6.896 | 46% | 0.022 | 193.86 | 38.84 | -1.16 | 1 |